

Table of Contents
- Green Building Materials ROI: Why the Numbers Matter in 2026
- Market Size and Growth: The Financial Case for Green Materials
- Using a Green Building ROI Calculator to Compare Material Choices
- Sustainable Building Materials Lifecycle Cost Analysis
- Building Material Payback Period: When Energy Savings Break Even
- Green Building Materials and Resale Value: What Buyers Actually Pay
- 2026 Incentives, Tax Credits, and Financing for Green Materials
- Calculating Your Project’s True ROI on Green Building Materials
- Frequently Asked Questions
Last Updated: October 13, 2026
Green Building Materials ROI: Why the Numbers Matter in 2026
Will upfront costs pay back through energy savings, resale value, and incentives? The roi of green building materials in 2026 is measurable, and for many projects, compelling.
Green building materials deliver value through energy savings, reduced heating and cooling loads, and improved indoor air quality and durability.
This guide shows how to calculate the roi of green building materials for your project: comparing lifecycle costs, understanding payback periods, and factoring in 2026 incentives.
Market Size and Growth: The Financial Case for Green Materials
Forecasts through 2026 project continued growth: buildings that consume less energy cost less to operate, and green labeling enhances asset value and marketability.
Markets with aggressive energy codes, strong incentives, and higher electricity costs see faster adoption. Residential leads in energy-conscious regions; commercial follows, driven by occupier demand for low-operating-cost buildings.
Green building materials reduce operational costs, improve property value, and qualify for tax credits and rebates.
Using a Green Building ROI Calculator to Compare Material Choices
A green building ROI calculator compares material options side by side, accounting for upfront cost, energy savings, maintenance differences, and incentives, showing clients exactly what they’re paying for and what they’ll get back.
The best calculators let you input:
- Material cost and installation labor
- Annual energy consumption and utility rates
- Maintenance and replacement cycles
SC Design incorporates lifecycle cost analysis into mechanical design and material recommendations.
The calculator reveals which choices move the needle and which add cost without meaningful benefit, some green products are premium-priced for marginal gains, others deliver outsized returns.
Sustainable Building Materials Lifecycle Cost Analysis
Lifecycle cost analysis compares total cost of ownership over 20 to 30 years: upfront material and labor plus future energy, maintenance, repair, and replacement expenses.
Most builders focus only on upfront cost, which is shortsighted.
The analysis requires assumptions about utility rates, inflation, maintenance costs, and holding period.
SC Design incorporates lifecycle cost analysis into mechanical design and material recommendations, letting numbers drive decisions rather than marketing claims.
Building Material Payback Period: When Energy Savings Break Even
The payback period answers how many years until energy savings equal the upfront cost premium. It is the number owners ask for first, and the one most often quoted without assumptions.
The math is simple: divide the upfront cost premium by annual savings.
Payback period (years) = Upfront cost premium ÷ Annual savings
A material costing $5,000 more than baseline and saving $800 per year has a 6.25-year payback; after that, all savings are profit.
Material-by-Material Cost Premiums and Payback
The table below shows typical upfront premiums and payback ranges for common green choices in residential and light commercial projects. These are planning ranges, not quotes, actual numbers depend on climate zone, utility rates, labor market, and baseline efficiency.
| Material or system | Typical upfront premium vs. code-minimum baseline | Typical annual savings driver | Typical payback range |
|---|---|---|---|
| Advanced wall insulation (higher R-value, better air sealing) | Moderate | Reduced heating and cooling load | 4-8 years |
| High-performance glazing (double or triple pane, low-E, argon) | Moderate to high | Reduced heating and cooling load, reduced peak demand | 5-10 years |
| Heat pump HVAC (air-source or ground-source) | Moderate to high | Displaces gas or resistance heating; higher seasonal efficiency | 6-12 years |
| Heat pump water heater | Low to moderate | Displaces gas or resistance water heating | 4-8 years |
| Cool or reflective roofing | Low to moderate | Reduced cooling load, extended roof life | 5-12 years |
| Recycled-content steel or low-carbon concrete | Low to moderate | Durability and embodied-carbon value; limited direct energy savings | 8-20 years or longer |
| High-performance windows plus exterior shading | Moderate | Reduced cooling load and peak demand | 6-12 years |
| Smart building controls and commissioning | Low | Reduced waste, optimized scheduling | 3-7 years |
Two patterns matter more than any row. Envelope measures (insulation, air sealing, glazing, shading) have the longest payback because they save energy indirectly by reducing load, but they last longest, so lifecycle return often beats simple payback.
Why the Same Material Has Different Paybacks in Different Projects
Payback is not a property of the material but of the material in a specific building in a specific market. Four variables drive most variation:
- Baseline efficiency. Replacing an old, inefficient system produces a much shorter payback than upgrading from a code-minimum new system. The worse the baseline, the faster the payback.
- Utility rates and rate structure. High electricity rates shorten payback for efficiency measures. Time-of-use rates reward measures that cut peak demand, such as glazing, shading, and controls.
- Climate zone. Insulation and glazing pay back fastest in extreme heating or cooling climates and slowest in mild ones.
Sensitivity: What Happens When Assumptions Move
A single payback number is a point estimate. Sensitivity analysis shows how the answer changes when inputs move. Three variables matter most:
- Energy price escalation. If utility rates rise faster than the general inflation rate you assumed, payback shortens. If they fall, payback lengthens. For most efficiency measures, the direction of energy prices is the single largest source of uncertainty.
- Discount rate. A higher discount rate (the return the owner could earn elsewhere) lengthens the effective payback when you move from simple payback to net present value. A lower discount rate favors longer-lived envelope measures.
- Occupancy and behavior. Savings depend on how the building is actually used. A high-performance envelope in a building that is under-occupied or over-cooled will not deliver modeled savings.
A practical rule: run payback at three energy-price scenarios (flat, moderate, high escalation) and two holding periods (short, long). If the measure stays positive in the least favorable combination, the decision is robust; if it only works in the most favorable, it’s a bet on energy prices.
When Long Paybacks Still Make Sense
Shorter paybacks make financial sense for most owners. Longer paybacks require at least one of the following:
- Strong resale value gains documented through energy performance ratings or green certifications.
- Non-energy benefits such as durability, lower maintenance, improved indoor air quality, comfort, and resilience.
- Long holding periods where the owner captures decades of savings.
Owners who occupy a building for its full economic life almost always benefit from green materials; three-year flippers may not. Understanding payback, and its assumptions, sets realistic expectations and prevents both over-promising and under-investing.
When you present a payback number to a client, write the four assumptions next to it: baseline, utility rate, climate zone, and holding period. A payback figure without assumptions invites the client to substitute their own and conclude the analysis was wrong.
Green Building Materials and Resale Value: What Buyers Actually Pay
Energy-efficient homes and buildings command measurable resale premiums because buyers recognize that low-operating-cost properties cost less to own.
Research indicates energy-efficient homes sell faster and at higher prices.
Building material resale value premiums are strongest in markets where:
- Electricity costs are high
- Buyers include investors and owner-occupants
- Energy performance is clearly documented
Residential construction in efficiency-conscious markets sees 3-5% resale premiums for certified green homes. Commercial buildings with documented low operating costs command even stronger premiums because occupiers directly experience the savings.
SC Design documents energy performance and green material specifications so buyers and appraisers recognize the value.
2026 Incentives, Tax Credits, and Financing for Green Materials
Federal, state, and local incentives directly reduce the cost of green building materials, and in 2026 they are the single largest lever most projects have to improve ROI.
The catch: incentives vary by technology, building type, owner-occupancy, income level, and the year work is placed in service. A specification that maximizes incentives in one state may leave money on the table in another.
Federal Tax Credits and Deductions
The federal programs most relevant to green material ROI fall into three groups:
- Residential clean energy and efficiency credits. The Inflation Reduction Act created and expanded credits for qualifying home improvements, including heat pumps, heat pump water heaters, insulation and air sealing, windows and doors, and electrical panel upgrades (Home Upgrades). Most of these are structured as a percentage of project cost, subject to annual caps that differ by category. Some categories have separate caps for the credit itself and for the total amount that can be claimed across years.
- Commercial building deductions and credits. Commercial projects can access deductions for energy-efficient commercial building property and, in some cases, credits tied to clean energy generation or storage. These are typically claimed by the building owner and require documentation of the efficiency improvement over a baseline.
- Clean energy generation and storage credits. Solar, battery storage, and related systems have their own credit structures, with adders for domestic content, energy communities, and low-income or tribal benefit. These adders can materially change the economics of an on-site generation system.
Two mechanics matter for ROI: most federal credits are non-refundable, reducing tax liability but not generating a check if liability is already zero; and credits are claimed in the tax year the property is placed in service, so timing matters.
State, Utility, and Local Programs
State and local programs fill the gaps federal credits leave, often targeting the same technologies with different rules:
- State energy office rebates. Many states run rebate programs for HVAC, envelope, and appliance upgrades, sometimes with income-qualified tiers that pay a higher percentage.
- Utility rebates. Investor-owned and cooperative utilities frequently offer prescriptive rebates (a fixed dollar amount per unit) or custom rebates (based on measured or modeled savings). Prescriptive rebates are easier to claim; custom rebates can be larger for complex projects.
- Property tax abatements and assessment programs. Some jurisdictions offer temporary property tax abatements for green-certified buildings, or allow the cost of efficiency improvements to be excluded from assessed value.
How Incentives Stack, and Where They Don’t
The ROI improvement from incentives depends on stacking rules:
- Federal credits and utility rebates can usually be combined, but the utility rebate may reduce the basis on which the federal credit is calculated. Check the ordering rules before you assume full stacking.
- State rebates and utility rebates sometimes cannot be combined for the same measure, or are capped at a percentage of project cost.
- Some programs require pre-approval before installation. Work done before approval is often ineligible.
A practical approach: build an incentive stack table for each measure, federal credit, state rebate, utility rebate, local abatement, financing, apply the stacking rules, and use the net upfront cost, not gross, in payback and ROI calculations.
Financing Structures That Change the ROI Math
Financing isn’t just a way to pay for a project; it changes the ROI calculation itself. Three structures are common in 2026:
- Traditional construction or renovation loans. The efficiency premium is rolled into the project loan. The relevant comparison is the loan payment versus the monthly energy savings, a measure that saves more per month than it costs to finance is cash-flow positive from day one.
- PACE and on-bill financing. These tie repayment to the property or the utility account rather than the owner’s balance sheet, which can make them available to owners who would not qualify for a conventional loan. They also transfer with the property in many cases, which matters for shorter holding periods.
- Energy performance contracts and shared-savings agreements. Common in commercial projects, these shift performance risk to a third party in exchange for a share of the savings. They reduce the owner’s upside but also reduce the downside if savings underperform.
A Worked Example of Incentive Impact
Consider a residential retrofit with a $25,000 gross cost premium for envelope and equipment upgrades.
That’s why incentive capture is a design decision, not an afterthought: choosing a qualifying efficiency level, documenting performance correctly, and applying before installation can move a marginal project into attractive territory.
SC Design tracks current incentive programs and incorporates them into project economics, identifying qualifying materials and systems and structuring specifications to maximize incentive capture while meeting performance goals.
Incentive programs change annually, have limited budgets, and often require pre-approval before work begins. Verify current program rules, caps, and deadlines with your state energy office, your utility, and a qualified tax professional before you finalize a specification. Do not rely on last year’s rules.
Build an incentive stack table for every measure in the project: federal credit, state rebate, utility rebate, local abatement, and financing. Apply the stacking rules, then use the net cost, not the gross cost, in your payback and ROI calculations.
Calculating Your Project’s True ROI on Green Building Materials
True ROI on green building materials accounts for all financial impacts: upfront cost, energy savings, maintenance differences, resale value, incentives, and financing costs.
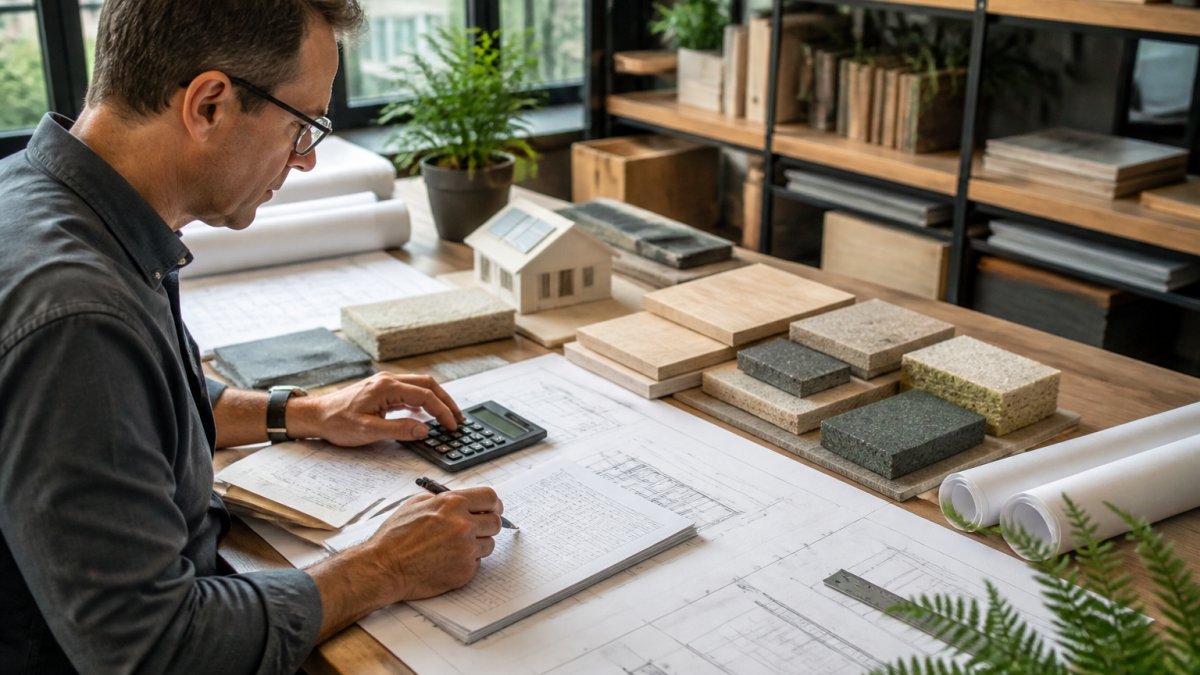
The calculation requires specific inputs:
| Component | Input | Impact on ROI |
|---|---|---|
| Material cost premium | Dollars | Reduces initial ROI |
| Annual energy savings | Dollars per year | Improves annual returns |
| Maintenance cost difference | Dollars per year | Improves or reduces returns |
| Resale value premium | Percentage | Improves exit returns |
| Tax credits and rebates | Dollars | Reduces upfront cost |
| Financing costs | Interest rate | Affects total cost |
| Holding period | Years | Determines payback timeline |
A typical residential green retrofit calculation:
Material and labor cost premium: $25,000. Annual energy savings: $2,400. Tax credits and rebates: $8,000. Resale value premium: $15,000. Holding period: 15 years.
Net upfront cost after incentives: $17,000. Total energy savings over 15 years: $36,000. Resale value gain: $15,000. Total return: $51,000.
SC Design builds these calculations into every project, showing clients exactly what they’re paying for and what they’ll get back.
The gap between what builders think green materials cost and what they actually return is where opportunity lives.
SC Design helps architects, builders, and developers quantify this return. That’s how we build homes and buildings that are more valuable to own and easier to sell. Learn more about energy-efficient building design principles from the Department of Energy or contact SC Design to discuss how green building materials can improve your project’s financial performance.
Frequently Asked Questions
How do you calculate the ROI of green building materials?
Start with upfront material and installation cost, then subtract annual operational savings (energy, water, maintenance). Divide the net cost by annual savings to find payback period in years. For example, a $15,000 insulation upgrade saving $1,500 annually pays back in 10 years. Include incentives and tax credits to reduce the initial investment. Most green building materials ROI calculations also factor in resale value gains and avoided future replacement costs over a 30-year lifecycle.
How long does it typically take for energy-efficient materials to pay for themselves?
Payback periods vary by material and climate. High-efficiency HVAC systems often break even in 7-12 years. Insulation upgrades typically pay back in 8-15 years depending on energy costs. Solar-ready roofing and cool roofs can achieve payback in 5-10 years in sunny regions. Tax credits and rebates available in 2026 can reduce payback by 2-4 years. Location, utility rates, and occupancy patterns all affect the timeline significantly.
Do green building materials increase a home’s resale value?
Yes, but not dollar-for-dollar with upfront cost. Studies show energy-efficient homes command 3-5% higher resale prices and sell faster. Homes with ENERGY STAR certification, high-performance mechanical systems, and superior indoor air quality appeal to buyers willing to pay premiums. However, resale value gains depend on local market conditions, buyer demographics, and how well the green features are documented and marketed. Builders should track energy performance data and certifications to justify the premium to future buyers.
What factors most affect the payback period for sustainable building materials?
The three largest factors are local utility rates (higher rates shorten payback), climate zone (colder or hotter regions see faster returns), and material quality and installation (poor installation reduces savings). Occupancy patterns matter too: full-time occupied homes realize savings faster than part-time residences. Available incentives, tax credits, and rebates can cut 20-40% from effective cost. Material lifespan and maintenance costs also shift the lifecycle economics, durable green materials with low upkeep deliver better long-term ROI than cheaper alternatives requiring frequent replacement.