
Table of Contents
- Energy Performance Gaps in Modern Housing: Why the Meter Disagrees With the Model
- Actual vs. Predicted Home Energy Use: How Big Is the Gap?
- Home Energy Modeling Accuracy: Where Design Assumptions Break Down
- Occupant Behavior and Building Operation: The Human Variables in Energy Use
- Building Envelope Air Leakage and Construction Quality: When Workmanship Undermines Performance
- Energy-Efficient Home Commissioning and Post-Occupancy Checks: Closing the Loop
- A Practical Homeowner Diagnostic Workflow for Energy Performance Gaps
- Step 1: Build a 12-month energy baseline
- Step 2: Separate base load from seasonal load
- Step 3: Normalize for weather before you conclude anything
- Step 4: Compare measured use to the model, carefully
- Step 5: Inspect the envelope and the controls
- Step 6: Instrument the home if the picture is still unclear
- Step 7: Prioritize fixes by cost, effort, and impact
- A note on comfort, health, and trade-offs
- Conclusion: Turning Performance Data Into Better Homes
- Frequently Asked Questions
Last Updated: October 7, 2026
Energy Performance Gaps in Modern Housing: Why the Meter Disagrees With the Model
A home can perform beautifully on paper and still disappoint once lived in. At SC Design, we work with architects, builders, and developers who need high-performance homes to deliver in the real world, not just in modeling software.
A home energy model estimates how much energy a house should use based on size, insulation, windows, and mechanical systems. The utility meter records what the household actually consumes.
Actual vs. Predicted Home Energy Use: How Big Is the Gap?
The gap is real, and it usually runs one direction: homes use more energy than predicted.
Energy modeling is a planning tool, not a promise. It assumes a set number of occupants, a thermostat setting, and a schedule for appliances and hot water.
A few things drive most of the variation:
- Occupancy levels that differ from the design assumption
- Thermostat habits that push heating and cooling harder than planned
- Plug loads from electronics the model never counted
The gap varies widely by building and household. What matters is whether your home is drifting from its target, and why, that is where building performance assessment starts.
A performance gap is rarely one big failure. It is usually several small differences, each minor on its own, stacking up over a full year of living.
Home Energy Modeling Accuracy: Where Design Assumptions Break Down
Home energy modeling accuracy depends entirely on the assumptions you feed the model. Modelers set default occupancy, internal heat gain, and air-change rates, defaults that suit an average household, not yours.
The design assumptions that most often miss the mark:
- Air leakage rates set to a target the construction team may not hit
- Equipment performance rated at lab conditions, not real ones
- Setpoints that assume steady temperatures rather than real comfort swings
This is not a software flaw but a gap between a standardized model and a specific family. Treat the model as a baseline, not a final answer.
Occupant Behavior and Building Operation: The Human Variables in Energy Use
Occupant behavior is the largest single reason predicted and actual energy use diverge, and the hardest to control.
People open windows, crank the heat, and run space heaters in cold rooms. None of that is wrong, but all of it shows up on the meter.
The human variables that matter most:
- Thermostat settings and how often they change
- Window and door use that bypasses the mechanical system
- Appliance and hot water habits that vary by household
Building operation compounds this. A well-tuned system with clear controls performs differently than the same system run on defaults nobody understands.
The most effective comfort fix is rarely a bigger system. It is usually clearer controls and a short walkthrough for the people who will live there.
Building Envelope Air Leakage and Construction Quality: When Workmanship Undermines Performance
Building envelope air leakage is where good design meets real-world construction, and the two do not always agree.
Common weak points we look for:
- Penetrations for wiring, plumbing, and vents
- Window and door rough openings that were not sealed fully
- Rim joists and top plates where framing meets the envelope
When these details are missed, the home loses conditioned air and pulls in unconditioned air, driving up heating and ventilation loads and undercutting comfort. You cannot model your way out of this performance deficit; you have to build it right.
Energy-Efficient Home Commissioning and Post-Occupancy Checks: Closing the Loop
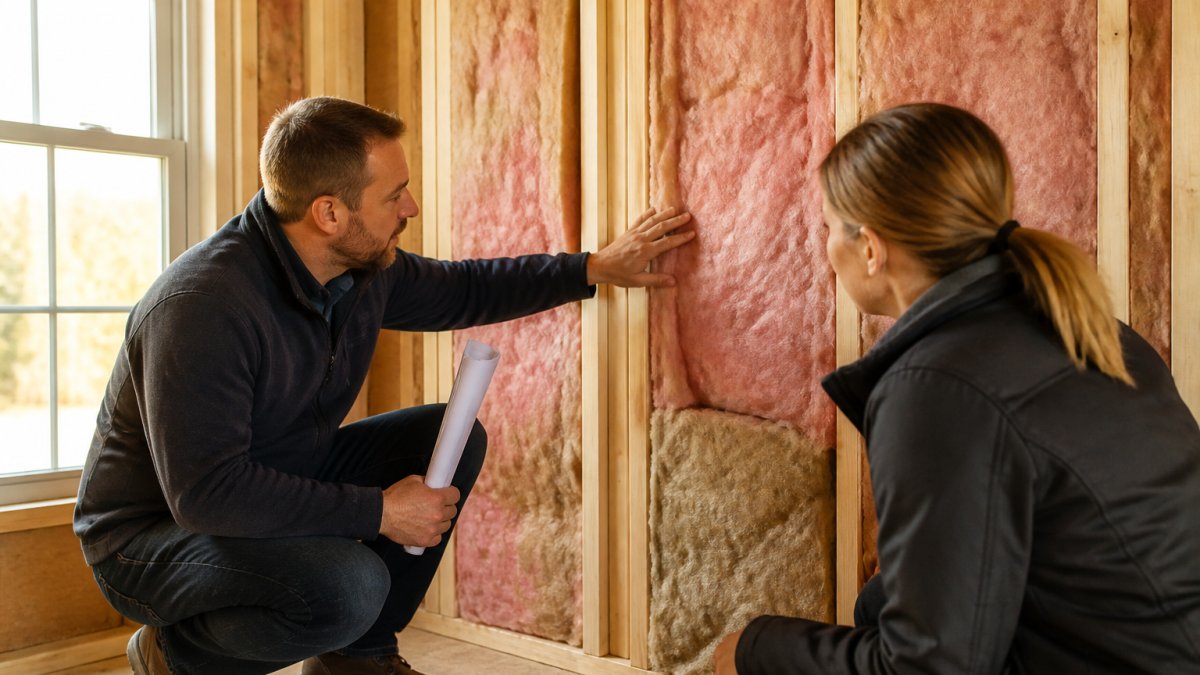
Energy-efficient home commissioning is the step most projects skip, and the one that closes the gap. Commissioning means testing and adjusting systems so they run as designed before move-in; post-occupancy checks verify performance after the home is lived in, when real behavior and weather enter the picture. Together they form a loop, design intent, verified installation, measured performance, corrective action, that most residential projects never complete.
What a real commissioning checklist covers
A high-performance commissioning process typically includes:
- Envelope verification. A blower door test to measure air changes per hour at a reference pressure, compared against the design target. For tight homes, many programs also require a duct leakage test.
- Mechanical system verification. Confirm airflow at each register against design, check refrigerant charge and static pressure on forced-air systems, verify balance across zones, and confirm ventilation delivers the intended outdoor air rate.
- Control verification. Walk every thermostat, damper, and ventilation control. Confirm schedules, setpoints, and override behavior match design intent, and that the homeowner can operate them.
Post-occupancy checks: when and what to measure
The most useful post-occupancy check happens after the first full heating and cooling season, with a second at the one-year mark. At each check, gather:
- Twelve months of utility data, normalized for weather using heating and cooling degree days
- Comfort feedback from occupants, room by room, including any rooms that are too hot, too cold, or damp
- Control settings as actually used, not as designed
Compare weather-normalized measured use against the model and the commissioning baseline. The pattern of drift tells you where to look: base load drift points to equipment or plug loads, seasonal drift to envelope or mechanical performance, and comfort complaints without an energy gap to distribution or controls.
Retrofit performance: re-baseline, don’t assume
Post-retrofit performance follows the same logic, plus one rule: re-baseline. After any upgrade to building fabric or mechanical systems, the old baseline is obsolete. Re-measure envelope tightness, re-verify airflow and balance, and re-collect utility data for a full season before drawing conclusions.
A common pattern: a retrofit delivers less savings than predicted because the home was already tighter or better-operated than the model assumed, or because new equipment was not commissioned properly.
A simple commissioning and verification timeline
| Stage | What You Check | Why It Matters |
|---|---|---|
| Design | Assumptions, targets, controls plan | Sets a realistic baseline |
| Construction | Air sealing, insulation, penetrations | Protects the envelope target |
| Pre-occupancy commissioning | Blower door, airflow, balance, controls | Confirms systems run as designed |
| First-season post-occupancy | Bills, comfort, seasonal data | Catches drift early, while warranty leverage exists |
| One-year review | Weather-normalized annual data | Establishes the real performance baseline |
| After retrofit | Re-measure envelope, systems, and use | Proves the upgrade worked against a new baseline |
The U.S. Department of Energy’s building energy resources outline how whole-building performance is verified, and the U.S. Environmental Protection Agency’s indoor air quality guidance connects tight construction to ventilation and comfort.
Schedule the first post-occupancy check before the builder’s warranty period ends. That is when corrective work is most likely to be covered, and when the commissioning data is still fresh enough to be useful.
A Practical Homeowner Diagnostic Workflow for Energy Performance Gaps
You do not need a research lab to find a performance gap, just a repeatable process. This is the workflow we walk clients through.

Most published work stops at describing the gap. What follows helps a household decide what to do next: gather data, normalize it, interpret it, and sequence fixes by cost, disruption, and expected impact.
Step 1: Build a 12-month energy baseline
Pull 12 consecutive months of utility data, not a single season: total consumption (kWh for electricity, therms or CCF for gas) per billing period, plus days in each period to convert to a daily average.
If your utility offers downloadable interval data, many provide hourly or 15-minute usage online, grab that too. It shows when energy is used, not just how much, separating a genuine performance gap from a schedule change.
Step 2: Separate base load from seasonal load
Total use is roughly base load plus seasonal load. Base load runs year-round: refrigeration, standby electronics, water heating in some homes, always-on ventilation.
Estimate base load from the lowest-use month, often a mild spring or fall month when neither heating nor cooling dominates.
A gap in base load points to equipment, controls, or plug loads; a gap in seasonal load points to the envelope, mechanical system, or operation.
Step 3: Normalize for weather before you conclude anything
Weather is the biggest confounder in home diagnostics. A cold winter or hot summer can make a well-performing home look like a problem case, while a mild season can hide a real issue. Compare energy use against heating degree days (HDD) and cooling degree days (CDD), published by your utility or a public weather source, and plot daily energy use against HDD or CDD per billing period.
Step 4: Compare measured use to the model, carefully
Line up weather-normalized measured use against the model’s predicted figure. Before calling it a gap, confirm the model’s assumptions: conditioned floor area, occupancy count, thermostat setpoints, and whether plug loads and hot water were included.
Often the model assumed a smaller household, narrower thermostat band, or lower plug load than reality. Adjust the inputs to match, then compare. If the gap persists, you have a genuine performance issue worth chasing.
Step 5: Inspect the envelope and the controls
Walk the home on a cold, windy day. Feel for drafts at outlets, window and door frames, rim joists, and penetrations for wiring, plumbing, or vents, condensation on interior surfaces often signals air leakage or a thermal bridge. Then review the controls: confirm the thermostat schedule matches actual occupancy, check that ventilation runs when it should, and look at smart thermostat runtime history, which reports daily heating and cooling hours and quickly spots a system working harder than designed.
Step 6: Instrument the home if the picture is still unclear
For households that want more resolution, a few inexpensive tools go a long way:
- Smart meter or utility portal data for whole-home interval usage
- Plug-in energy monitors for large individual loads like refrigerators, freezers, and entertainment centers
- Temperature and humidity sensors in a few rooms to check whether comfort complaints match actual conditions
Submetering one circuit, the water heater or an HVAC air handler, can isolate a load quietly driving a gap.
Step 7: Prioritize fixes by cost, effort, and impact
Once you know where the gap comes from, sequence the work:
- Low cost, low disruption, high impact: air sealing at obvious leak points, correcting thermostat schedules, replacing filters, sealing reachable duct leaks, adjusting ventilation runtime.
- Moderate cost, moderate disruption, high impact: adding insulation in attics or rim joists, sealing and insulating ducts in unconditioned space, upgrading to a smart thermostat with proper setup.
- Higher cost, high disruption, targeted impact: equipment replacement, window upgrades, or envelope retrofits, justified when diagnostics point clearly at those systems and the home will be occupied long enough to recover the investment.
Skipping weather normalization is the most common mistake in home diagnostics. It leads homeowners to chase a problem that is really just a hard season, and to ignore a real issue hidden inside a mild one.
A performance gap is rarely one big failure. It is usually several small differences, each minor on its own, stacking up over a full year of living. The workflow above is designed to find those small differences in the order that costs the least to fix.
A note on comfort, health, and trade-offs
Not every gap is a defect. Sometimes a home uses more energy than modeled because the occupants keep it warmer in winter, cooler in summer, or ventilate more than the design assumed, and those choices often improve comfort, indoor air quality, and health. The U.S. Environmental Protection Agency’s indoor air quality guidance is a useful reference for balancing tight construction with adequate ventilation.
Conclusion: Turning Performance Data Into Better Homes
The gap between predicted and measured energy use is not a reason to distrust energy modeling, it is a reason to measure, verify, and adjust after the home is built and lived in.
That is the work we do at SC Design. We help architects, builders, and developers close the gap through Zero Energy Design consulting, Built Green™ design principles, and mechanical design that holds up in real homes.
Get started with SC Design and build homes that match their numbers.
Frequently Asked Questions
What is the energy performance gap in a home?
The energy performance gap is the difference between a home’s predicted energy consumption, calculated during design with energy modeling software, and its actual energy consumption measured from utility bills. In modern housing, actual use often exceeds predictions by 30% to 100% or more. This gap matters because it affects operating costs, indoor comfort, and whether a home truly delivers the efficiency its design promised.
How can builders measure the energy performance gap?
Builders can measure the gap by comparing design-phase energy models with real utility data after occupancy. Start by collecting 12 months of utility bills, then weather-normalize the data using heating and cooling degree days. Tools like utility bill analysis software or home energy monitoring systems can help. Pair this with a blower door test to quantify building envelope air leakage. Documenting actual vs. predicted home energy use gives a clear performance baseline.
How do occupant habits affect a home’s energy use?
Occupant behavior is one of the largest drivers of the energy performance gap. Thermostat setpoints, hot water use, window operation, and appliance choices can swing a home’s energy demand by 50% or more. A family that keeps the thermostat at 68°F in winter uses far less energy than one that sets it at 75°F. Energy modeling usually assumes average behavior, so real households often diverge from predictions.
Can poor construction quality cause higher energy bills?
Yes. Construction quality and workmanship directly affect building envelope air leakage and insulation performance. Gaps around windows, doors, and penetrations let conditioned air escape, forcing HVAC systems to work harder. Even small defects, like missing insulation in a wall cavity or unsealed duct joints, can increase energy use by 20% to 30%. Commissioning and blower door testing catch these issues before they become costly problems.